


G+ Ripples is a visualization of how links are shared by users on Google+.
On Google+, it's common for users to "reshare" someone else's post as a way of calling attention or commenting on it. Because you can reshare someone's else resharing, information spreads in a complex cascade.
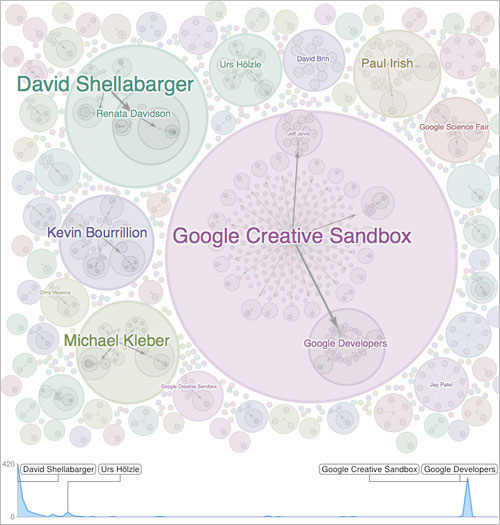
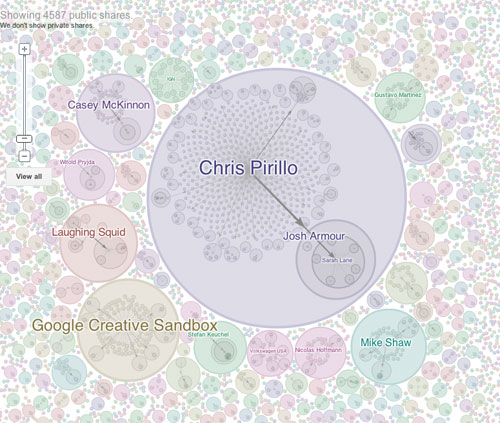
Ripples visualizes this process, displaying all public posts that contain a given URL. In a Ripples diagram, each large colored circle shows the spread of a single post. Concentric circles show reshares, and circles within those show further chains of resharing.
Unlike other visualizations of social network activity, Ripples is a "native" visualizations: it is embedded directly into Google+. Any link or public Google+ post that has been reshared publicly has a Ripples view.
Using Ripples, it's possible to see many different patterns of sharing.
News articles, celebrity posts, and viral videos all yield distinct
pictures. This diagram, for example, shows the spread of a petition in favor of open science:

We've even used Ripples to visualize the spread of our own visualizations.
The image below shows how news of the wind map
spread on Google+: